Predictive Analytics & Forecasting
 White-Label & Dedicated Teams - Offshore developers, maintenance and agency support
Headless CMS - Sanity, Payload, Storyblok, Prismic, Contentful, Strapi and Next.js
AI Solutions - AI agents, chatbots, automation and machine learning
WordPress & WooCommerce - Custom themes, plugins and online stores
Shopify & eCommerce - Shopify, BigCommerce, PrestaShop and Webflow builds
HubSpot CMS - Custom themes, modules and integrations
Custom Web Development - PHP, Laravel, CodeIgniter, CakePHP, MERN and MEAN
Mobile App Development - iOS, Android, Flutter and React Native
Business Software - CRM, ERP, SaaS and enterprise applications
UI/UX & Frontend - Figma, design systems and pixel-accurate Figma-to-HTML
Plan for what is likely next
Predictive Analytics & Forecasting
Most planning still relies on last year’s numbers plus a gut feeling. When demand shifts or a key customer leaves, the plan is wrong and the cost shows up as empty shelves, idle staff or lost revenue.
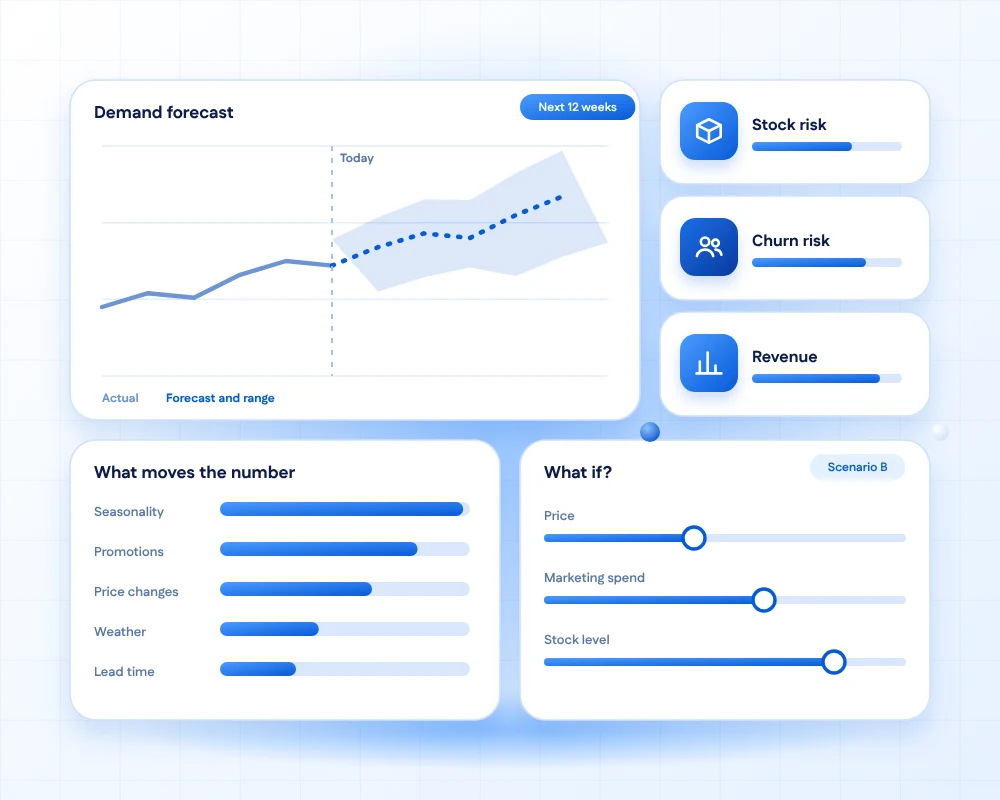
We build forecasts and predictive models for demand, churn, revenue and risk. They come with honest ranges, plain-language explanations of what drives them and what-if tools for planners.
Every model is backtested against your current method first, so you know what improvement to expect before you rely on it.
- 11+Years of building business software
- 50+Global long-term clients
- 2,000+Projects delivered
- 24 hrsResponse time on queries
What we predict
Six questions forecasting can answer
Each one ties to a decision someone already has to make.

How much will we sell?
Demand forecasts by product, region and week, so stock and staffing match what is coming.
Demand
Who is likely to leave?
Churn and renewal risk by customer, with the reasons, so account teams act early.
Churn
What will revenue look like?
Revenue and cash-flow forecasts with ranges, updated as new data arrives.
Revenue
Where is the risk?
Credit, claims, supplier and project risk scored and explained.
Risk
When will it break or arrive?
Predicted failures, delays and delivery times for equipment and shipments.
Operations
Who will buy next?
Propensity scores that focus sales and marketing effort where it is likely to pay.
Growth
How we forecast
Honest, explainable and testable
A forecast nobody trusts is not used. These six habits earn that trust.
We aim for the simplest model that is accurate enough, not the most impressive one.
Use your history
Sales, usage, prices, promotions, weather and events, prepared and checked for gaps.

Try simple first
Seasonal baselines and simple models are tested before anything complex.

Test on the past
Models are backtested on periods they have not seen, so accuracy is measured, not claimed.

Show the range
Forecasts come with an uncertainty band, so decisions reflect the risk.

Explain the drivers
People see what moves the number, in plain language they can challenge.

Ask what if
Scenario tools test price, promotion or stock changes before you commit.
What we measure
A forecast is judged by the decisions it improves
We agree these measures before modelling and track them after launch.
How we work
From decision to monitored forecast
Five steps that keep forecasts useful.
Pick the decision
Choose the decision the forecast will change, and who will use it, before any modelling.
ScopeGather and clean data
Combine internal and external data, fix gaps and agree what counts as an outlier.
DataBuild and backtest
Compare candidate models against your current method on past periods.
ModelPut it in planners’ hands
Dashboards, alerts or integration into your planning tools, with explanations.
DeliverMonitor and improve
Track error and bias, retrain on new data and review with the planning team regularly.
Operate
Built to be trusted
What we verify in every forecast
The details that decide whether planners rely on it.
- A clear baselineWe compare against your current forecast, so improvement is visible.
- Honest backtestingNo peeking at the future when evaluating the model.
- Handling of eventsPromotions, holidays, stock-outs and one-off shocks are treated explicitly.
- Uncertainty shownRanges, not single numbers, so decisions reflect risk.
- Human overridePlanners can adjust forecasts, and overrides are recorded and learned from.
- Drift monitoringWe watch error over time and retrain when the world changes.
Related services
Build on solid foundations
Good forecasts rest on good data and good operations.
FAQs
Predictive analytics questions, answered
Predictive analytics uses historical data and statistical or machine learning models to estimate what is likely to happen, such as next month’s demand, which customers may leave or which invoices will be paid late.
It depends on how predictable the underlying thing is and on data quality. We measure accuracy by backtesting on past periods, compare it with your current method and report forecast error and bias openly, with ranges rather than single numbers.
For time-series forecasting, at least a couple of seasonal cycles, often two or more years, helps. For churn or risk models, thousands of examples help. We assess your data in the first weeks and tell you honestly what is possible.
Yes. We show the main drivers behind a forecast or score, and for decisions that affect people we use methods that can be explained and audited.
We treat promotions, holidays, stock-outs and one-off shocks explicitly, and we use ranges and scenario tools. No model can predict the truly unforeseen, so we also build in monitoring and human override.
Dashboards describe what has happened. Predictive analytics estimates what is likely next. The two work together: clean historical data and good dashboards make predictions easier to build and trust.
Yes. We build simple scenario tools so planners can test changes in price, promotion, stock or capacity and see the likely effect, with the uncertainty shown.
Through dashboards, scheduled reports, alerts or direct integration with planning, ERP, CRM or inventory tools, so forecasts are used where decisions are made.
A backtested prototype often takes four to eight weeks. A production system with integration, monitoring and training for planners usually takes three to five months.
Yes. We monitor error and bias, retrain as new data arrives and review results with your planners under a support plan with agreed response times.
Ready for forecasts you can plan with?
Tell us the decision you want to improve and share a sample of your history. We will backtest a forecast against your current method and show you the difference.